SR ZONES PRO
SR Zones Pro NT8
Support and resistance, built the way price actually behaves.
Most S/R tools draw a line wherever a swing forms and leave it there forever. SR Zones Pro takes the harder path: it treats every level as a living thing — one that earns strength through respect, loses it through neglect, and changes character when it finally breaks.
Clustering, Not Cluttering
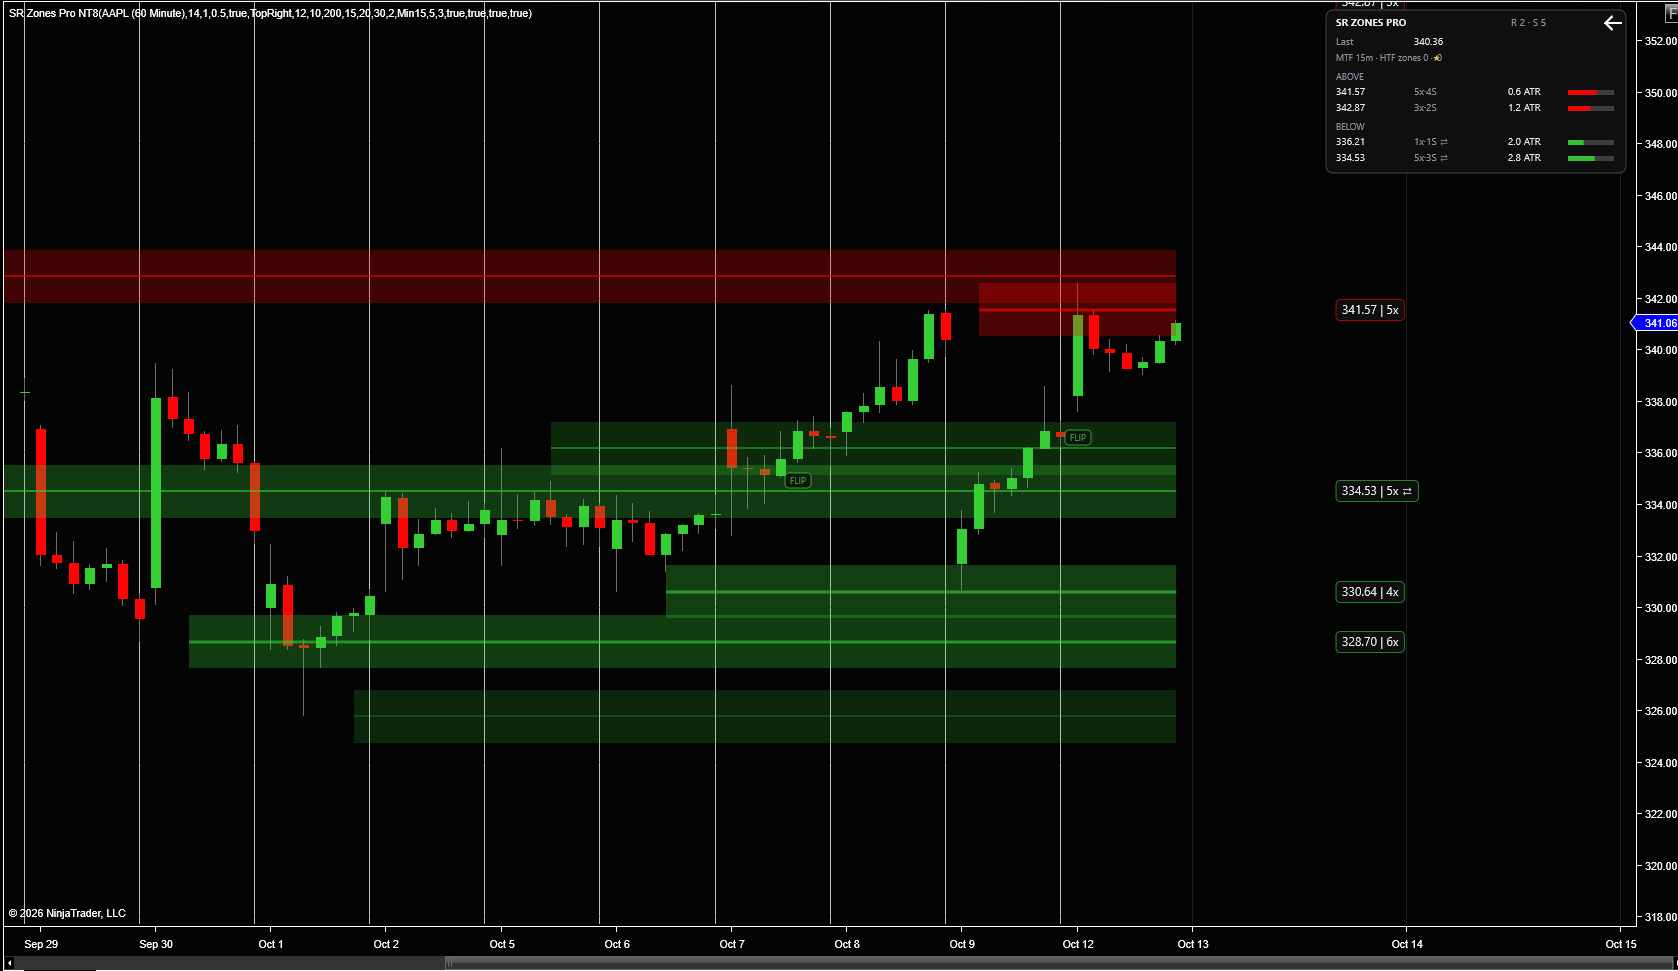
The indicator identifies swing pivots using configurable left/right bar counts (5/3 by default, 8/5 for cleaner charts). Rather than drawing three lines for three nearby highs, it merges any pivots within 0.5 × ATR into a single zone at their weighted-average price.
The result is a chart that reads cleanly. One zone, one decision.
Strength You Can See
Every zone carries a score that drives its opacity and line width. Brighter and thicker means stronger. The score is built from:
Strong touches — the wick entered the band but the candle body closed outside it. Weighted at 15 points.
Soft touches — price closed inside the band. Weighted at 7 points.
Volume — contacts on above-average volume push strength higher. Institutional levels light up.
MTF confluence — when the same level forms on both your chart timeframe and a higher timeframe, it earns a ★ marker and +15 strength.
Breaks and age — both subtract. Untouched zones fade slowly; higher-timeframe zones age 4× slower.
Levels That Flip, Not Fail
When price closes beyond a zone by 1.5 × cluster distance, the zone doesn't disappear. With Role Flip enabled, broken resistance becomes support — counters reset, a FLIP chip marks the conversion bar, and a 5-bar cooldown prevents whipsaw double-flips.
Post-flip retests are then treated as normal touches automatically. The classic polarity retest becomes a first-class signal.
The Info Panel — Your Trade-Planning Surface
The panel shows the two nearest zones above and below live price, each with:
Distance in ATR
Touch count and strong-rejection count
Badges for confluence and role flips
A visual strength bar
Entries near a high-strength zone 1–2 ATR away. Caution when price is wedged between two strong zones. The panel tells you which situation you're in.
Built for Real Charts
Zones expire when they stop mattering — after 200 bars untouched, or when breaks outnumber touches with at least three breaks. A 30-zone cap keeps the display focused. Far-away zones hide automatically based on ATR distance.
Four tutorial scenarios are included — Range, Breakout, Reversal, and Chop — so you can see how the algorithm behaves in each market condition before you trade it live. Settings for pivot sensitivity, cluster distance, MTF timeframe, and appearance are all adjustable from the NinjaTrader property grid.